 As we begin to reopen society, data released this week shows physician visit volumes have rebounded slightly from the bottom out in the month of April.
The burning question is will the recovery happen quickly enough to avoid an extinction event in smaller private practices?
Fee for service private practice has been hammered by declines of visit volumes of 50 - 70%. No business can withstand an assault on its top line income of this magnitude for any significant period of time.
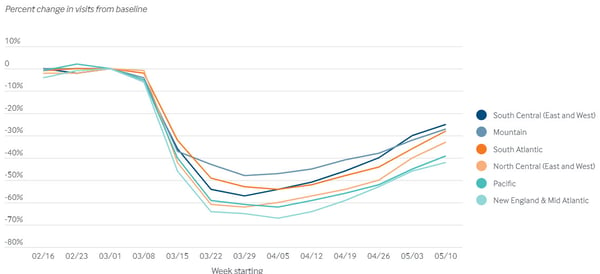
New research shows outpatient visits appear to have bottomed out in early April and are on the rebound. The curve is upward with volumes still 30-40% below baseline volumes from January and February of this year.
Given the US healthcare system's addiction to fee for service payments, the recovery in visit volumes and income must come quickly.
If the curve does not quickly assume a V or U shape, smaller physician owned groups who cannot survived a prolonged income drop will go out of business en masse before the end of the year. Unfortunately that does not look like a U or V to me.
Here is the latest data on US Visit volumes from a unique source that tells the whole story.
Here is the latest data, trends and graphs from The Commonwealth Fund
https://www.commonwealthfund.org/publications/2020/apr/impact-covid-19-outpatient-visits
DATA SOURCE:
Researchers at Harvard University and Phreesia, a health care technology company, analyzed data on changes in visit volume for the more than 50,000 providers that are Phreesia clients. During the study period (mid-February to mid-May) there were more than 12 million visits.
FINDINGS:
=> The number of visits to ambulatory practices decreased by 60% as of early April.
=> Since then there has been a rebound, however visit volumes are still down by about 1/3.
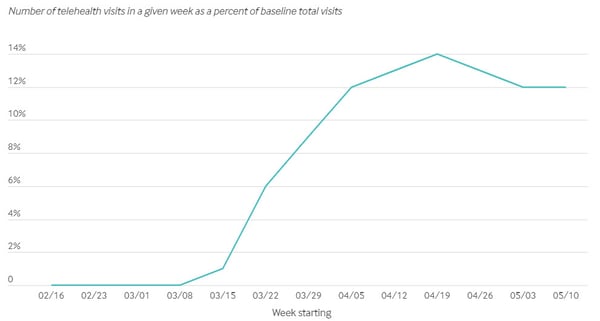
=> As in-person visits fell, telehealth/virtual visits increased rapidly and have now plateaued.
=> The current visit volume rebound is due to a rebound in in-person visits.
=>The fall and rebound in visit volumes is consistent over
>>Geographic region
>>Specialty
>>Provider organization size
GRAPHS:
Percent change in visit volumes from baseline:

Number of telehealth visits in a given week as a percent of baseline total visits:

Full Details at:
https://www.commonwealthfund.org/publications/2020/apr/impact-covid-19-outpatient-visits
=============
PLEASE LEAVE A COMMENT:
Are you seeing a rebound in visit volumes in your area?
What shape do you think this curve will take?
Will the rebound come in time to save small outpatient practices?

